Collecting and display sensor data can be fun and helpful. Wouldn’t it be interesting to know the average temperature of last month based on sensor data collected using Arduino, MQTT and a time series database? Ever wanted to know the postman’s show-up times for making future predictions? At Maker Faire Hannover 2017 I presented a demo how to collect sensor data using Arduino and how to display it.
My Arduino solution
This article is derived from 2 years old notes and some parts were neccessary to change for Raspberry Pi 3.
Now focusing on the Raspberry Pi 3 to act as server, the guide has been adjusted. If there is any improvement, please leave a comment. This setup is actually configured for local use, therefore encryption is not enabled. For internet use, you will want to encrypt the communication between Arduino and mosquitto. So Grafana web interface should be TLS-enabled using letsencrypt.
There will be posts about extending this demo later.
Let’s begin.
Open-Source software used for this
- Raspbian
- Arduino IDE
- Arduino-ESP8266 extension
- mosquitto MQTT server
- InfluxData Telegraf
- InfluxData InfluxDB
- Grafana
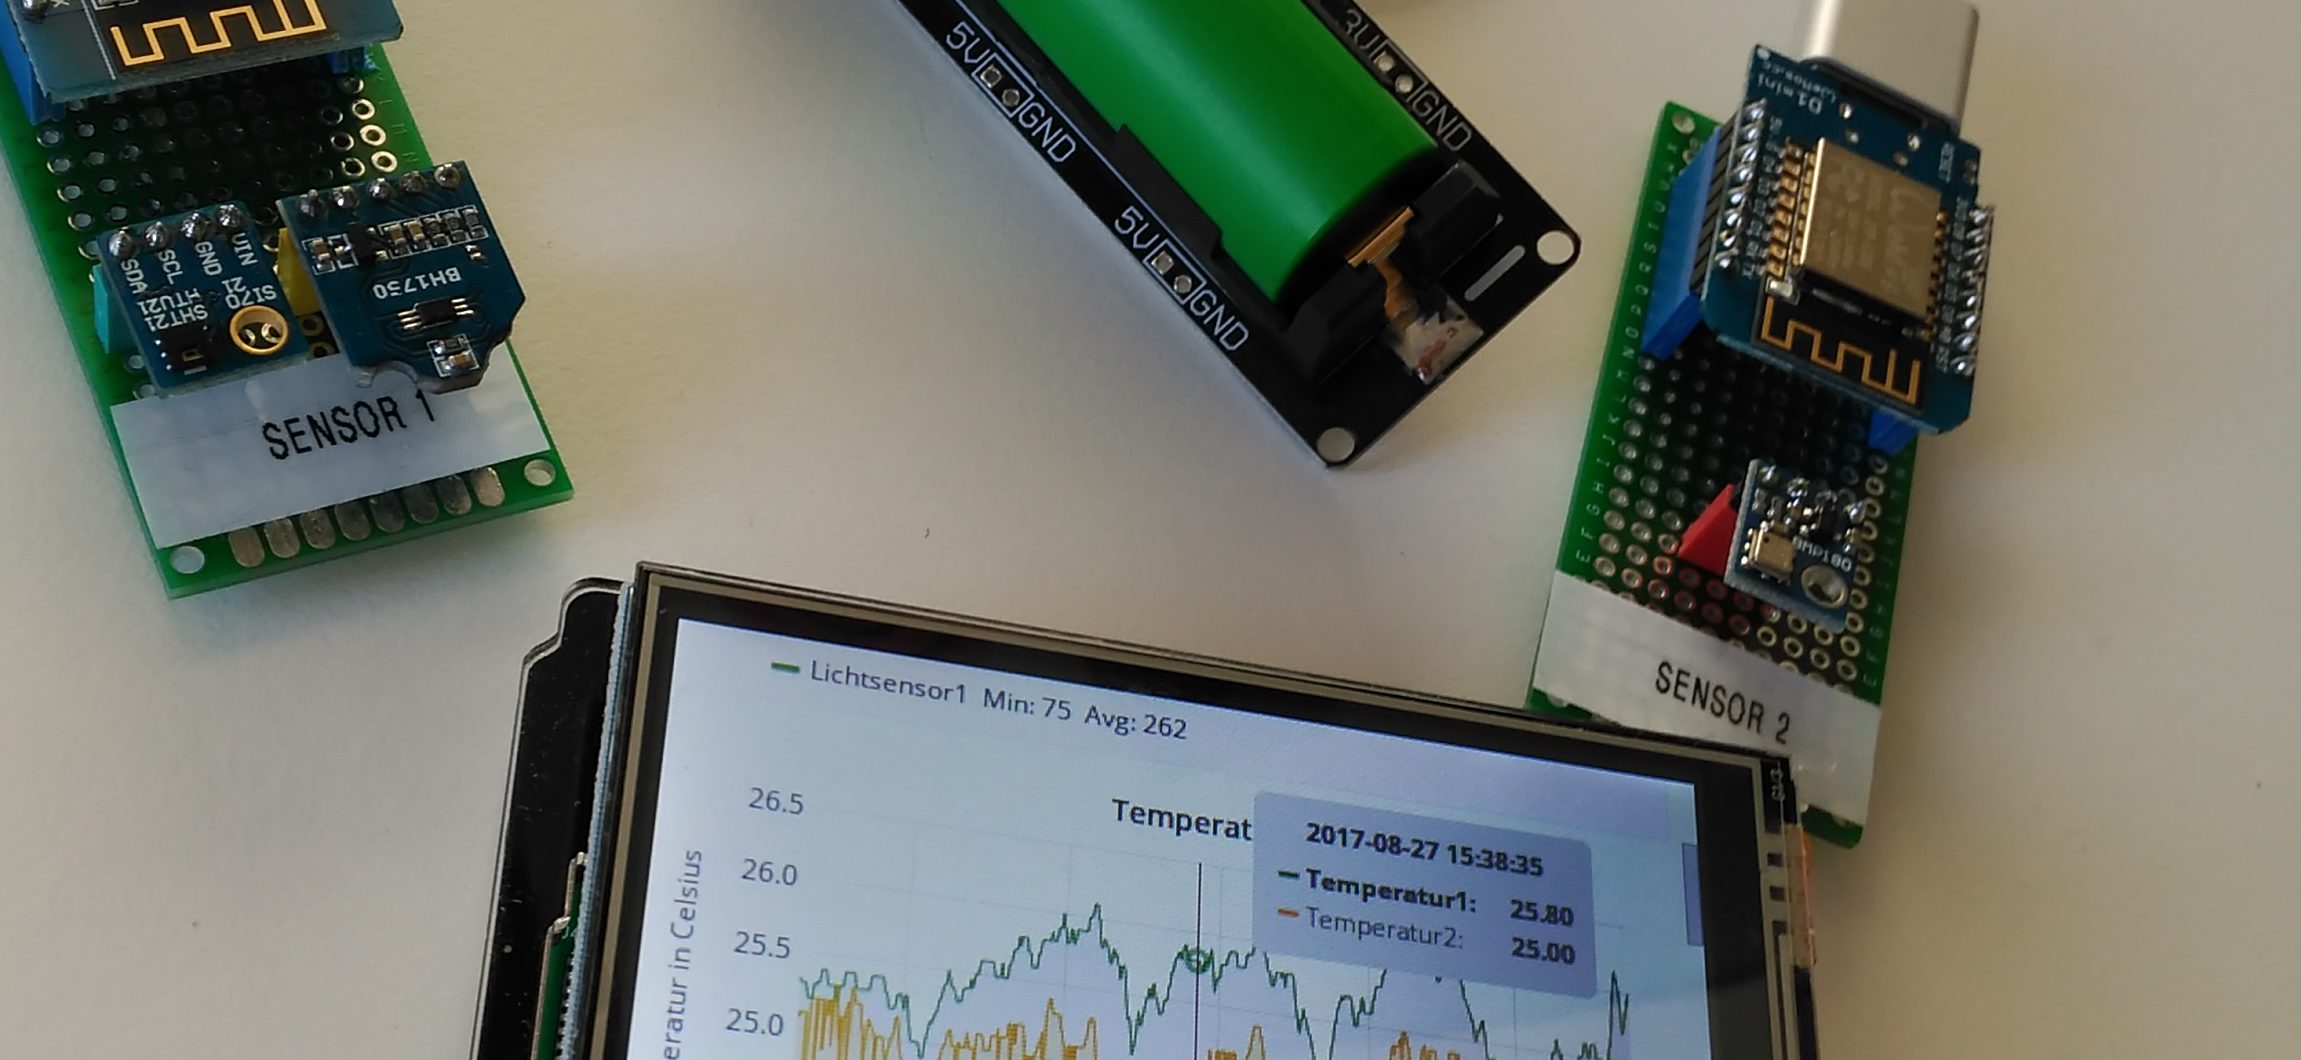
The hardware
- Rasbperry Pi 3 (1, 2 working aswell)
- LCD touch shield (or HDMI display)
- Wemos D1 mini (ESP8266)
- BMP180 temperature and pressure sensor
- BH1750 light sensor
- HTU21 temperature and humidity sensor
- 18650 batteries for power supply
- Tiny pcb for quick assembly
Data flow
Sensor data is read from I2C capable sensors and delivered to a MQTT server running on raspberry pi.
It is like a chat server where every sensor has its own channel (topic). Communication to MQTT can be encrypted using TLS.
As a substitute for raspberry pi, a cheap linux box can be used aswell. Cheap Linux VPS with SSD are easy to rent for about 5 $ per month. A Debian installation on any old laptop does the trick aswell. Pro: a builtin display to view the graphs.
Telegraf running on the raspberry pi is looking for all MQTT channels and fetches messages. Messages matching a defined input format will be imported to influxdb.
Influxdb stores the measurements and preaggregate values. As a time-series database running on Go, influxdb will respond to queries sent by Grafana.
With Grafana, dashboards can be built displaying graphs with data queried from influxdb.
The setup
That’s how the data flows in general. Let’s continue with the setup now.
Setup Raspbian
A todo-list lacking instruction details. Basic setup can be looked up somewhere else.
- Raspberry Pi has Internet connection via Router running DHCP
- Install Raspbian stretch (RASPBIAN STRETCH WITH DESKTOP)
Download image, write to SD card using Win32 Disk Imager (Windows) or dd (Mac & Linux)
Run and use raspi-config to:- Enable SSH
- Set timezone, language & keyboard layout
- Resize available disk storage
- Update system
- Install LCD driver
Instructions can be found here: http://www.waveshare.com/wiki/3.5inch_RPi_LCD_(A)
This has to be done after any kernel upgrade. - Avoid screen going blank / dim
sudo nano ~/.config/lxsession/LXDE-pi/autostart
# add this
@xset s off
@xset -dpms
@xset s noblank
Install mosquitto
Install mosquitto MQTT from repository.
sudo apt -y install mosquitto mosquitto-clients
After installing, mosquitto will be enabled to use authentification by writing this configuration to /etc/mosquitto/conf.d/auth.conf.
allow_anonymous false
password_file /etc/mosquitto/passwd
Create user arduino and set password.
sudo mosquitto_passwd -c /etc/mosquitto/passwd arduino
Reload service to apply changes.
sudo service mosquitto reload
For testing MQTT service, open up two shells. Run the first command to “subscribe” to topic test and the second one for messages to be published on the test topic.
# Shell window 1
mosquitto_sub -h localhost -t test -u "arduino" -P "arduino"
# Shell window 2
mosquitto_pub -h localhost -t "test" -m "hello world" -u "arduino" -P "arduino"
Your message should appear in shell 1. If true: Success.
Install influxdb
To install and update influxdb time-series database automatically using the package manager, add the repository and fetch the key.
curl -sL https://repos.influxdata.com/influxdb.key | sudo apt-key add -
echo "deb https://repos.influxdata.com/debian stretch stable" | sudo tee /etc/apt/sources.list.d/influxdb.list
Afterwards install influxdb.
sudo apt update
sudo apt -y install influxdb
Manual way: The installation package can be downloaded here.
For telegraf, credentials can be configured. Grafana will access influxdb with its own credentials. So create a pair aswell.
sudo service influxdb start
influx -execute "CREATE USER "telegraf" WITH PASSWORD 'inserthardtoreadpasswordhere' WITH ALL PRIVILEGES;"
influx -execute "CREATE USER "grafana" WITH PASSWORD 'forgrafanaaccess' WITH ALL PRIVILEGES;"
Install telegraf
Now install the adapter that picks the values from MQTT channels and sends it to influx.
Since the influxdata repository was added during the previous step, install telegraf just by typing:
sudo apt -y install telegraf
Again, package for manual installation can be found here.
To configure telegraf acting as MQTT consumer, open /etc/telegraf/telegraf.conf, scroll down to the section [[inputs.mqtt_consumer]] and uncomment it.
The import part looks like:
[..]
 # Read metrics from MQTT topic(s)
 [[inputs.mqtt_consumer]]
   servers = ["localhost:1883"]
   ## MQTT QoS, must be 0, 1, or 2
   qos = 0

   ## Topics to subscribe to
   topics = [
     "telegraf/host01/cpu",
     "telegraf/+/mem",
     "sensors/#",
   ]

   # if true, messages that can't be delivered while the subscriber is offline
   # will be delivered when it comes back (such as on service restart).
   # NOTE: if true, client_id MUST be set
   persistent_session = true
   # If empty, a random client ID will be generated.
   client_id = "telegraf"

   ## username and password to connect MQTT server.
   username = "telegraf"
   password = "importdatatoinfluxdb"

   ## Optional SSL Config
   # ssl_ca = "/etc/telegraf/ca.pem"
   # ssl_cert = "/etc/telegraf/cert.pem"
   # ssl_key = "/etc/telegraf/key.pem"
   ## Use SSL but skip chain & host verification
   # insecure_skip_verify = false

   ## Data format to consume.
   ## Each data format has its own unique set of configuration options, read
   ## more about them here:
   ## https://github.com/influxdata/telegraf/blob/master/docs/DATA_FORMATS_INPUT.md
   data_format = "influx"
[..]
As for username and password, new credentials should be generated for use with telegraf (telegraf:importdatatoinfluxdb).
sudo mosquitto_passwd -c /etc/mosquitto/passwd telegraf
sudo service mosquitto reload
Sensor data will be written to influxdb. For authentification insert the credentials created in the previous step.
Database name is changed aswell.
# Configuration for influxdb server to send metrics to
[[outputs.influxdb]]
  ## The HTTP or UDP URL for your InfluxDB instance.  Each item should be
  ## of the form:
  ##   scheme "://" host [ ":" port]
  ##
  ## Multiple urls can be specified as part of the same cluster,
  ## this means that only ONE of the urls will be written to each interval.
  # urls = ["udp://localhost:8089"] # UDP endpoint example
  urls = ["http://localhost:8086"] # required
  ## The target database for metrics (telegraf will create it if not exists).
  database = "arduinosensors" # required

  ## Name of existing retention policy to write to.  Empty string writes to
  ## the default retention policy.
  retention_policy = ""
  ## Write consistency (clusters only), can be: "any", "one", "quorum", "all"
  write_consistency = "any"

  ## Write timeout (for the InfluxDB client), formatted as a string.
  ## If not provided, will default to 5s. 0s means no timeout (not recommended).
  timeout = "5s"
  username = "telegraf"
  password = "inserthardtoreadpasswordhere"
  ## Set the user agent for HTTP POSTs (can be useful for log differentiation)
  # user_agent = "telegraf"
  ## Set UDP payload size, defaults to InfluxDB UDP Client default (512 bytes)
  # udp_payload = 512

  ## Optional SSL Config
  # ssl_ca = "/etc/telegraf/ca.pem"
  # ssl_cert = "/etc/telegraf/cert.pem"
  # ssl_key = "/etc/telegraf/key.pem"
  ## Use SSL but skip chain & host verification
  # insecure_skip_verify = false

  ## HTTP Proxy Config
  # http_proxy = "http://corporate.proxy:3128"

  ## Compress each HTTP request payload using GZIP.
  # content_encoding = "gzip"
Install grafana
Since grafana is not prebuilt for raspberry pi’s arm architecture, we would have to do it manually.
Luckily fg2it was kind enough to provide a package repository for raspberry pi. More to know is found in the wiki or on grafana itself.
curl https://bintray.com/user/downloadSubjectPublicKey?username=bintray | sudo apt-key add -
echo "deb https://dl.bintray.com/fg2it/deb jessie main" | sudo tee -a /etc/apt/sources.list.d/grafana.list
sudo apt update
sudo apt -y install grafana
sudo systemctl enable grafana-server
sudo service grafana-server start
It even works on a raspberry pi 1 which takes hours to install – I tested that just for the lulz.

After installing, the webinterface is accessible on port tcp/3000. Use admin:admin to login.
After login, click on the Grafana logo, go to Data Sources and click Add data source.
With the click on Add the connection is tested and established.
Next step will be to enable Arduino sensor to send some data to the system.
Configure the raspberry as WiFi hotspot
The raspberry pi 3 (with onboard wifi) is intended to act as access point for all the arduino sensor boards. These are delivering sensor data to mosquitto without any other access point in between.
# localhost
auto lo
iface lo inet loopback

# eth0
auto eth0
iface eth0 inet dhcp

# wireless
allow-hotplug wlan0
iface wlan0 inet static
address 192.168.1.1
netmask 255.255.255.0
Install dnsmasq
sudo apt -y install dnsmasq
Add configuration to file end. This will configure DHCP – dynamic ip configuration – for the Arduino clients accessing the MQTT server.
# DHCP active for wireless interface
interface=wlan0

# Ignore DHCP for eth0 (that will be handled by the LAN router - FritzBox or similar)
no-dhcp-interface=eth0

# IPv4 address and leasetime
dhcp-range=192.168.1.100,192.168.1.150,24h

# DNS
dhcp-option=option:dns-server,192.168.1.1
Test configuration and restart service.
# Test dnsmasq
dnsmasq --test -C /etc/dnsmasq.conf

# Restart service now
sudo systemctl restart dnsmasq
# Enable service for system start
sudo systemctl enable dnsmasq
Add option in /etc/dhcpcd.conf
denyinterfaces wlan0
Install hostapd WiFi access point.
sudo apt -y install hostapd
Configure the WiFi accesspoint. DHCP
interface=wlan0
ssid=ArduinoSensor
channel=1
hw_mode=g
ieee80211n=1
ieee80211d=1
country_code=DE
wmm_enabled=1
auth_algs=1
wpa=2
wpa_key_mgmt=WPA-PSK
rsn_pairwise=CCMP
wpa_passphrase=ArduinoSensorNetwork
Make file unreadable by any other system user.
sudo chmod 600 /etc/hostapd/hostapd.conf
Change the option to the proper configuration file to be used at startup by default.
DAEMON_CONF="/etc/hostapd/hostapd.conf"
Enable hostapd at system start.
sudo systemctl enable hostapd
sudo service hostapd start
Test the WiFi Hotspot. Output should contain “active”.
sudo service hostapd status
Info: Connected devices don’t have Internet access! If desired, routing directives will have to be added to iptables.
Arduino
The sensors do need some micro-assembly. For this purpose Wemos D1 mini is used and for quick demo a I2C sensor (BMP180) is added.
Arduino wiring
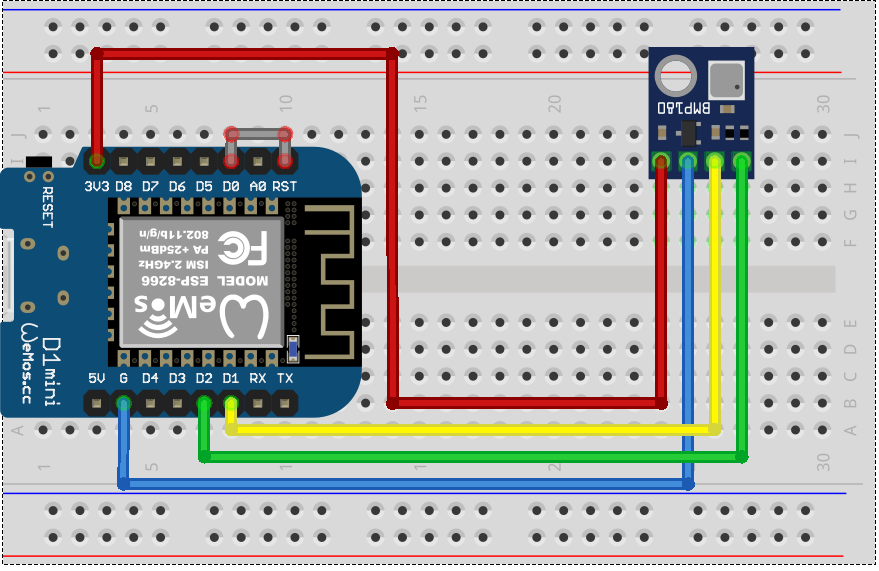
D1 – CLK BMP180
D2 – DATA BMP180
3V – V+ BMP180
GND – GND BMP180
RST + D0 = Deep Sleep enable
Arduino Sketch
My sensor sketch: https://gist.github.com/screenzone/7ddbb18b94b2acc2e8ad526dc503ad16
This sketch will work on Wemos D1 mini and can be easily extended and improved.
Necessary Arduino libraries:
Also have a look at Mongoose OS as alternative to this Arduino based solution.
Make data appear on display
Use the Arduino sketch to generate some sensor data. Afterwars a grafana dashboard can be built using influxdb as data source.
To launch the chrome as kiosk mode remotely via SSH use (change the url):
/usr/bin/chromium-browser --noerrordialogs --disable-session-crashed-bubble --disable-infobars --disable-translate --display=:0 --kiosk http://localhost:3000/dashboard/db/dashboard?refresh=1s&orgId=1&theme=light
If the touch capability of the TFT needs to be disabled:
# Disable touch (as root)
echo 1 > /sys/class/input/input0/device/disable
That’s it! Don’t hesitate to ask in the comments. A few detailed steps were skipped.
Writing this article took far more time than expected.
Mini how-to’s to operate this setup on a cheap Linux VPS is going to follow soon. Maybe there will be some youtube content 😉
Stay tuned.
Damian
I see you don’t monetize screenzone.eu, don’t waste
your traffic, you can earn extra bucks every month with new monetization method.
This is the best adsense alternative for any type of website
(they approve all sites), for more details simply search in gooogle:
murgrabia’s tools
I’ve followed your instructions – but now I’ve got the problem to read the data with telegraf which are succesully sent from my NodeMCU to the Raspi. How is the connection defined between the received messages of MQTT and the data fields in the Influx database ?