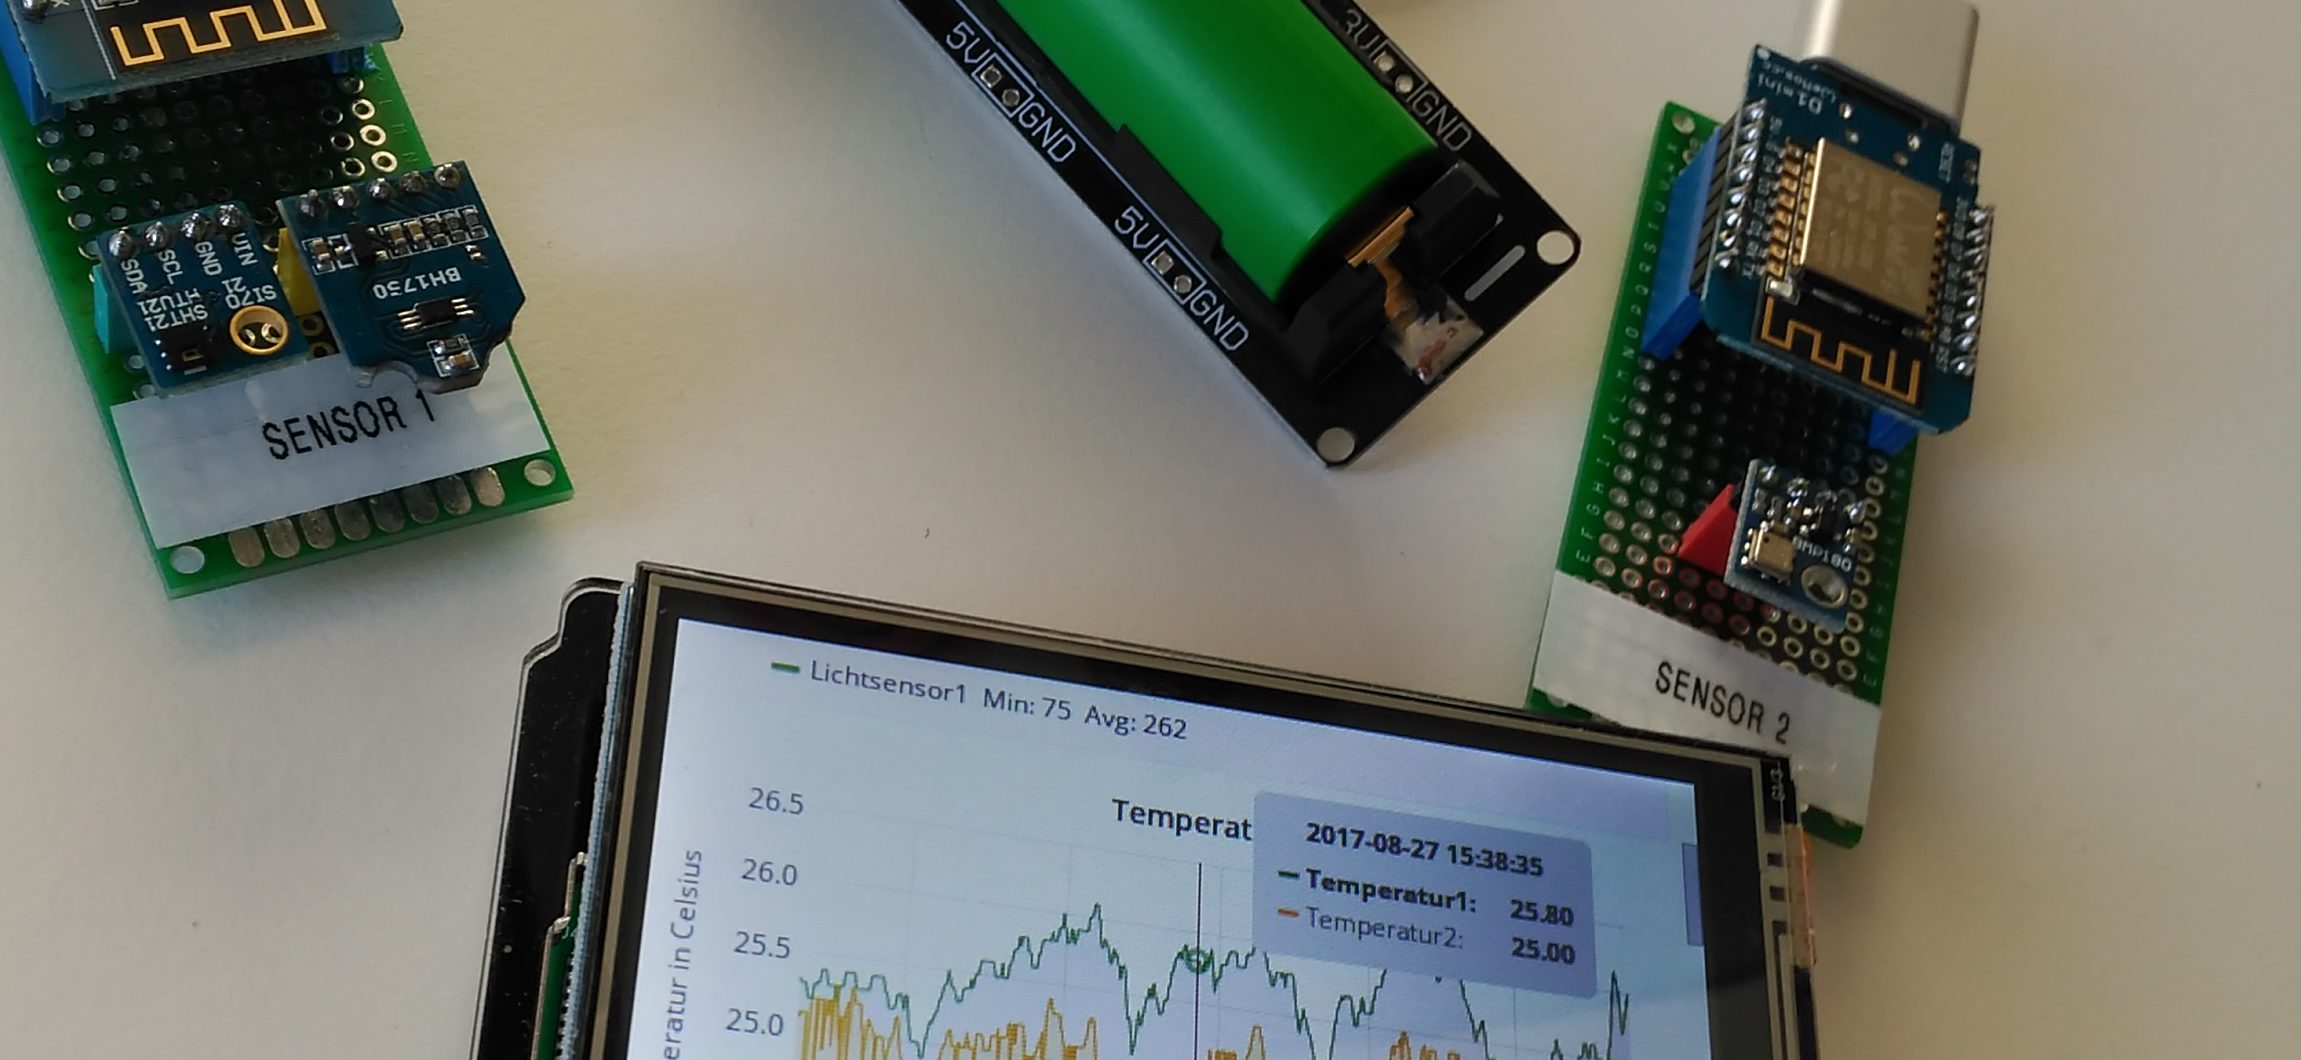
Collecting and display sensor data can be fun and helpful. Wouldn’t it be interesting to know the average temperature of last month based on sensor data collected using Arduino, MQTT and a time series database? Ever wanted to know the postman’s show-up times for making future predictions? At Maker Faire Hannover 2017 I presented a demo…